1.5. View Types Within a Content Type
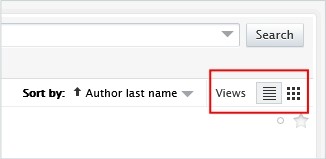
For exampe, for Research outputs, you can choose from the list view or the matrix view to visualise your data:
For exampe, for Research outputs, you can choose from the list view or the matrix view to visualise your data: